Demos
Try our software in your browser, on a simulated plant. Nothing to install.
The quickest way to see what we make is to use it. These demos open in your browser and run on a simulated plant, so you can click through the screens, start an alarm and watch what happens, without a sign-in and without touching a real site.
If you would rather see the platform with your own station's data, book a demonstration and we will set that up.
- OCEMS platform
- STP SCADA
- Datalogger screens
- Simulated plant
- No sign-in
Software
The two web applications: the cloud platform and the plant's management software.
-
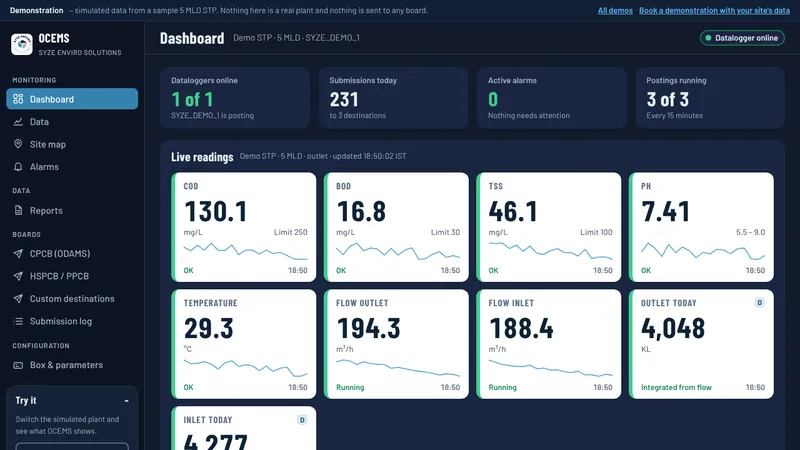
OCEMS cloud platform
The monitoring platform our dataloggers report to: live readings, trends, alarms, reports, and the log of every send to CPCB, HSPCB and a municipal server. A sample 5 MLD plant runs inside it.
Open the OCEMS demoStart an alarm, or cut the datalogger's link, from the Try it panel.
-
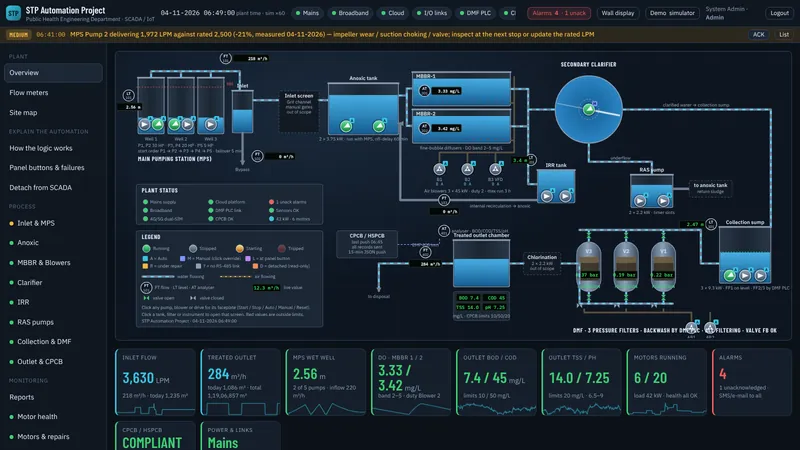
STP management software (SCADA)
A SCADA and IoT demonstration for a sewage treatment plant: process overview and site map, 20 motors with start and stop, auto and manual, and a switch to detach any motor from SCADA, flow meters in m³/h and MLD, how the automation decides, department reports, alarms, users with an audit trail, and a simulator for power return, sensor failure and link failure.
Open the SCADA demoPick a role to sign in; the demo fills in the credentials.
The datalogger's screen
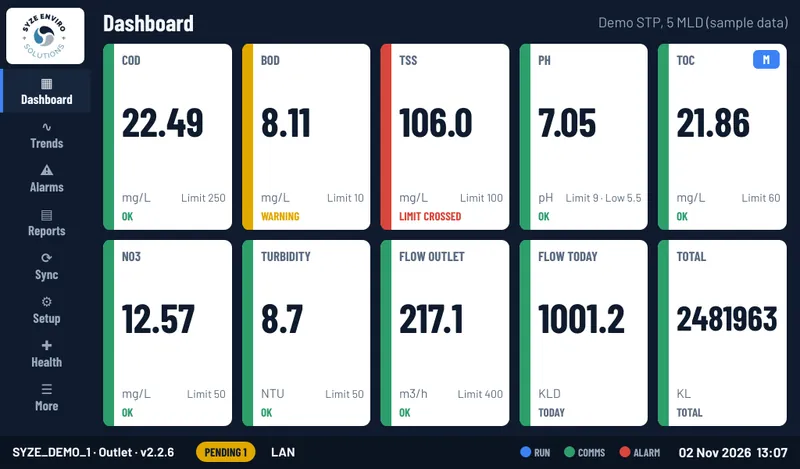
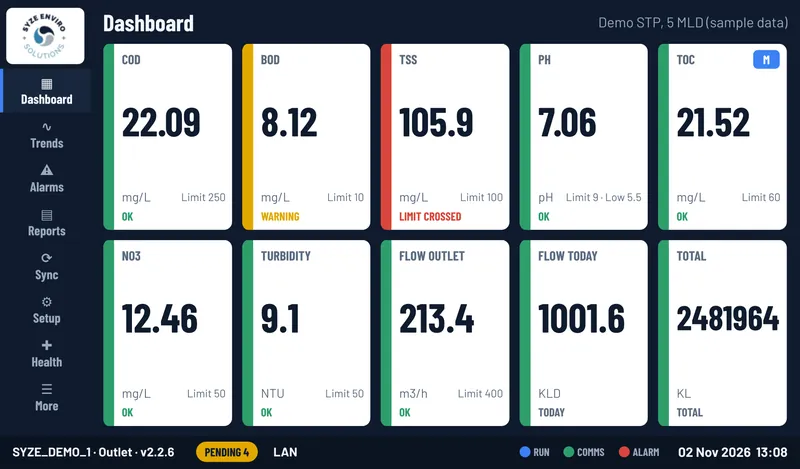
The logger box shows the plant's readings on its own screen, a 7-inch touchscreen or a 24-inch monitor over HDMI. These are the real screens of its software, captured with sample data.
-
SYZE logger touchscreen
The logger's own screen on the 7-inch touchscreen: dashboard, trends, alarms, reports, sync logs, setup and box health, as the operator sees them at the plant.
Open the touchscreen demoTap the menu on the left of the screen.
-
SYZE logger on a 24-inch HDMI screen
The same software enlarged for a control-room monitor, with the mouse pointer shown: the same dashboard, trends, alarms, reports, sync logs, setup and box health.
Open the 24-inch demoClick the menu, or play the tour.
What you are looking at
- A simulated plant
- The readings are made up and move like a real 5 MLD plant's would. Nothing is measured, and nothing is sent to CPCB, HSPCB, PPCB or to us.
- The way the software behaves
- Limits, alarms, flags, store-and-forward and the log of every send work as they do on a site. The OCEMS demo is a working model of the platform's main pages, built for this site, not a window into our servers.
- Real logger screens
- The two logger demos are screens of the actual logger software, captured with sample data.
- Your own site
- Ask for a demonstration and we will show the platform with your station's own readings and board settings.
Questions about the demos
Is any of this a real plant?
No. Every demo runs on a simulated plant. The names, readings and alarms are samples.
Do I need to sign in or install anything?
No. Each demo opens in the browser. The OCEMS demo and the logger screens also work on a phone; the SCADA screens are easiest to use on a laptop or tablet.
Can I see the real platform with my own data?
Yes. Send us your station details through the contact page and we will arrange a demonstration with your own site's data.
Does the demo change anything on a real system?
No. The demos run inside your browser and are not connected to a board or to a live plant.
Related
- Cloud dashboardMonitoring platform for water, air and infrastructure
- OCEMS data loggerMade by SYZE (OEM) for CPCB, HSPCB and PPCB connectivity
- STP automation (PLC, SCADA)PLC control of pumps, blowers and dosing, SCADA screens, and the plant's compliance data in the same place
- STP online monitoringOutlet effluent quality, inlet and outlet flow, and data to CPCB, HSPCB and PHED
- Online water quality analyser (8 parameters)Our main product: eight parameters as standard, made in India
- O&M, AMC and calibrationKeeping a station accurate, connected and accepted by the boards, year after year
See it working
Tell us about your plant and we will show the platform with your own station's data.